こんにちはーー
ガントチャートをエクセルで作成すると面倒ですよね。
今回はそんなガントチャートについて、Pythonのライブラリを使うと簡単に作成できることが分かったので記事にしました。
この記事が誰かの役に立てば幸いです。
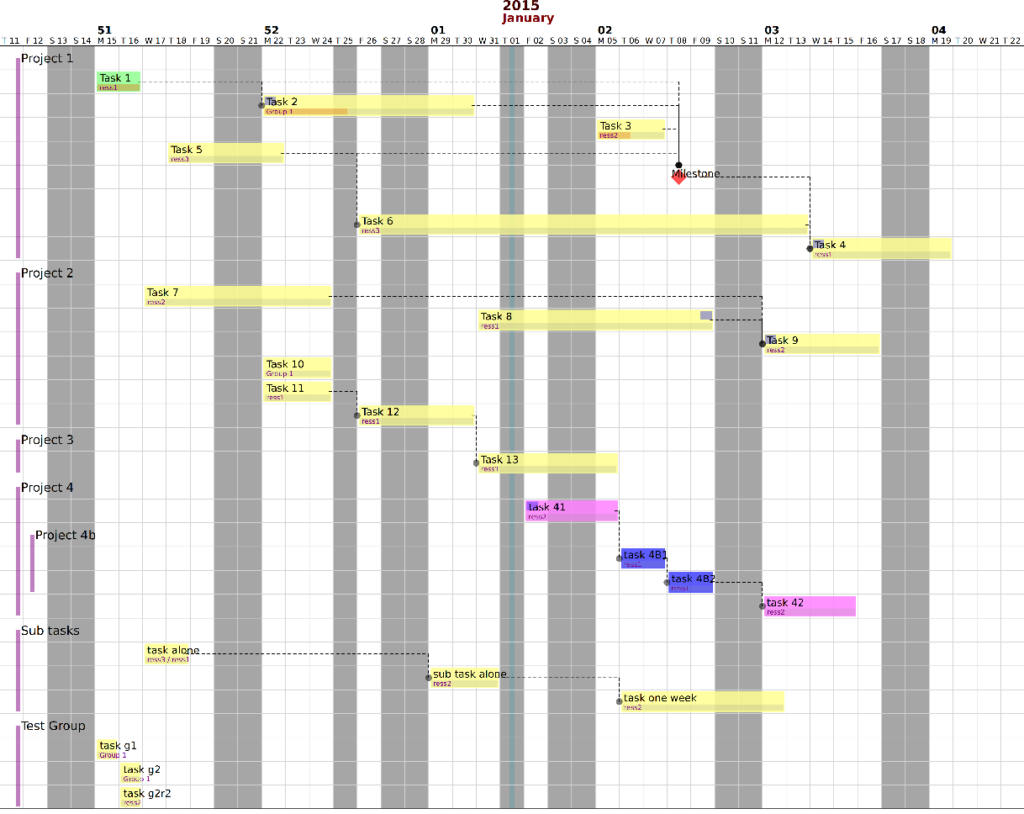
↓のようなガントチャートが簡単に作れます。

↓のようにリソース(担当者)毎に出力されるので便利です。

ライブラリのURL
まずは、↓のURLにライブラリと使い方など詳細が載っているのでこちらを参考ください。
Python-Gantt
Python-GanttmakepossibletoeasilydrawganttchartsfromPython.OutputformatisSVG.
動画でざっくり説明もしています。
(直接、参考にしたページを見た方が早いかもしれませんが)
ライブラリのインストール
元ページにインストール方法が丁寧に書かれているのでこちらを参考ください。

プログラム全文

↓がプログラムの全文です。
いじって出力して、いじって出力してを繰り返してみるとわかりやすいかと思います。
これ以外にも、ライブラリを直接編集することで色や体裁を整えることができます。
import datetime
import gantt

# Change font default
gantt.define_font_attributes(fill='black',
                             stroke='black',
                             stroke_width=0,
                             font_family="Verdana")

# Add vacations for everyone
gantt.add_vacations(datetime.date(2014, 12, 25))
gantt.add_vacations(datetime.date(2015, 1, 1))
gantt.add_vacations(datetime.date(2015, 1, 13))

# Create two resources
rANO = gantt.Resource('ANO')
rJLS = gantt.Resource('JLS')

# Add vacations for one lucky resource
rANO.add_vacations(
    dfrom=datetime.date(2014, 12, 29),
    dto=datetime.date(2015, 1, 4)
    )
rANO.add_vacations(
    dfrom=datetime.date(2015, 1, 6),
    dto=datetime.date(2015, 1, 8)
    )

# Test if this resource is  avalaible for some dates
print(rANO.is_available(datetime.date(2015, 1, 5)))
print(rANO.is_available(datetime.date(2015, 1, 8)))
print(rANO.is_available(datetime.date(2015, 1, 6)))
print(rANO.is_available(datetime.date(2015, 1, 2)))
print(rANO.is_available(datetime.date(2015, 1, 1)))


# Create some tasks
t1 = gantt.Task(name='tache1',
                start=datetime.date(2014, 12, 25),
                duration=4,
                percent_done=44,
                resources=[rANO],
                color="#FF8080")
t2 = gantt.Task(name='tache2',
                start=datetime.date(2014, 12, 28),
                duration=6,
                resources=[rJLS])
t7 = gantt.Task(name='tache7',
                start=datetime.date(2014, 12, 28),
                duration=5,
                percent_done=50)
t3 = gantt.Task(name='tache3',
                start=datetime.date(2014, 12, 25),
                duration=4,
                depends_of=[t1, t7, t2],
                resources=[rJLS])
t4 = gantt.Task(name='tache4',
                start=datetime.date(2015, 01, 01),
                duration=4,
                depends_of=t1,
                resources=[rJLS])
t5 = gantt.Task(name='tache5',
                start=datetime.date(2014, 12, 23),
                duration=3)
t6 = gantt.Task(name='tache6',
                start=datetime.date(2014, 12, 25),
                duration=4,
                depends_of=t7,
                resources=[rANO])
t8 = gantt.Task(name='tache8',
                start=datetime.date(2014, 12, 25),
                duration=4,
                depends_of=t7,
                resources=[rANO, rJLS])


# Create a project
p1 = gantt.Project(name='Projet 1')

# Add tasks to this project
p1.add_task(t1)
p1.add_task(t7)
p1.add_task(t2)
p1.add_task(t3)
p1.add_task(t5)
p1.add_task(t8)


# Create another project
p2 = gantt.Project(name='Projet 2', color='#FFFF40')

# Add tasks to this project
p2.add_task(t2)
p2.add_task(t4)


# Create another project
p = gantt.Project(name='Gantt')
# wich contains the first two projects
# and a single task
p.add_task(p1)
p.add_task(p2)
p.add_task(t6)


# Test cases for milestones
# Create another project
ptcm = gantt.Project(name='Test case for milestones')

tcm11 = gantt.Task(name='tcm11',
                   start=datetime.date(2014, 12, 25),
                   duration=4)
tcm12 = gantt.Task(name='tcm12',
                   start=datetime.date(2014, 12, 26),
                   duration=5)
ms1 = gantt.Milestone(name=' ',
                      depends_of=[tcm11, tcm12])
tcm21 = gantt.Task(name='tcm21',
                   start=datetime.date(2014, 12, 30),
                   duration=4,
                   depends_of=[ms1])
tcm22 = gantt.Task(name='tcm22',
                   start=datetime.date(2014, 12, 30),
                   duration=6,
                   depends_of=[ms1])
ms2 = gantt.Milestone(name='MS2',
                      depends_of=[ms1, tcm21, tcm22])
tcm31 = gantt.Task(name='tcm31',
                   start=datetime.date(2014, 12, 30),
                   duration=6,
                   depends_of=[ms2])
ms3 = gantt.Milestone(name='MS3', depends_of=[ms1])


ptcm.add_task(tcm11)
ptcm.add_task(tcm12)
ptcm.add_task(ms1)
ptcm.add_task(tcm21)
ptcm.add_task(tcm22)
ptcm.add_task(ms2)
ptcm.add_task(tcm31)
ptcm.add_task(ms3)


p.add_task(ptcm)

##########################$ MAKE DRAW ###############
p.make_svg_for_tasks(filename='test_full.svg',
                     today=datetime.date(2014, 12, 31),
                     start=datetime.date(2014,8, 22),
                     end=datetime.date(2015, 01, 14))
p.make_svg_for_tasks(filename='test_full2.svg',
                     today=datetime.date(2014, 12, 31))
p.make_svg_for_tasks(filename='test.svg',
                     today=datetime.date(2014, 12, 31),
                     start=datetime.date(2015, 01, 3),
                     end=datetime.date(2015, 01, 06))
p1.make_svg_for_tasks(filename='test_p1.svg',
                      today=datetime.date(2014, 12, 31))
p2.make_svg_for_tasks(filename='test_p2.svg',
                      today=datetime.date(2014, 12, 31))
p.make_svg_for_resources(filename='test_resources.svg',
                         today=datetime.date(2014, 12, 31),
                         resources=[rANO, rJLS])
p.make_svg_for_tasks(filename='test_weekly.svg',
                     today=datetime.date(2014, 12, 31),
                     scale=gantt.DRAW_WITH_WEEKLY_SCALE)
##########################$ /MAKE DRAW ###############
以上になります


コメント